Student Satisfaction Dashboard
The USD Student Satisfaction Dashboard summarizes data collected from all recent administrations of the Ruffalo Noel Levitz Student Satisfaction Inventory questionnaire.
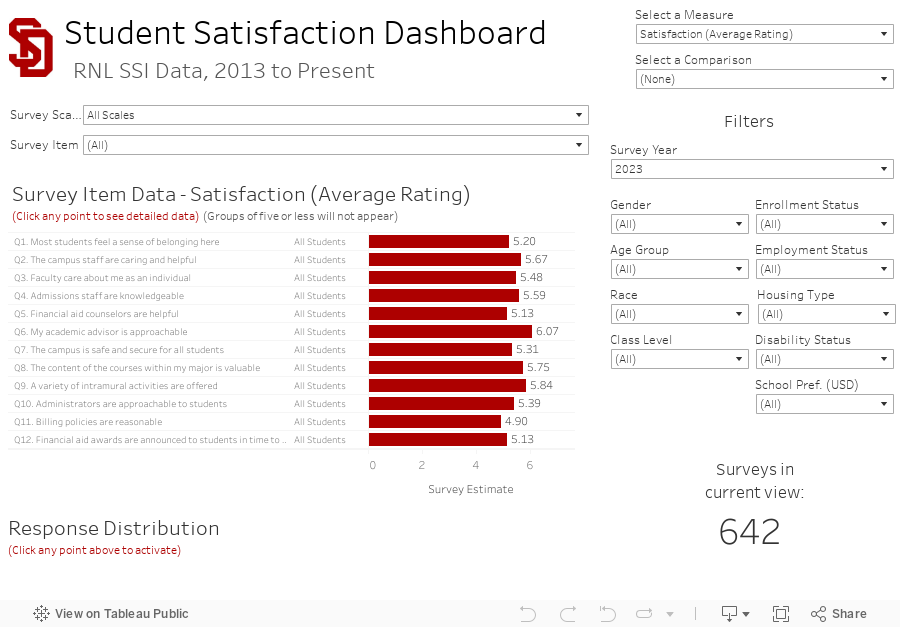
The university undertakes several regular efforts to gather student feedback on its performance. Among these projects is the biennial administration of the Ruffalo Noel Levitz Student Satisfaction Inventory (SSI) questionnaire. This survey, which is distributed every other spring term to USD’s on-campus student body, asks students to provide both “importance” ratings and “satisfaction” ratings for a variety of campus offices and services. While this survey is not the only source of such information, it nonetheless provides insightful data about the way students perceive the effectiveness of campus operations.
The USD Student Satisfaction Dashboard summarizes data collected from all recent administrations of this survey. Data can be displayed for all individual survey items used in the questionnaire, or can be limited to items related to particular themes (or “scales”) only. Data can be segmented by a variety of student characteristics, including gender, age group, and race. However, to protect respondent confidentiality, data are not shown for groups of five or less.
Source: Ruffalo Noel Levitz Student Satisfaction Inventory data files
Notes:
- The university’s SSI survey sample typically produces a generalized margin of error of approximately ±3.0 percent at the 95% confidence level. However, it should be understood that all data shown in this tool are derived from self-reported survey responses, and thus are subject to the same sources of systematic and non-systematic measurement error associated with any form of survey research. Consequently, all data depicted in this tool should be understood as estimates only.
- Graduate students were included in the SSI sample for the first time during the 2017 survey administration.
- All “average rating” indicators range from a minimum of one (lowest importance/satisfaction) to a maximum of seven (highest importance/satisfaction).
- For survey items 1-99, the “percent favorable” category (for importance indicators) includes the following original response options: “5 Somewhat important,” “6 Important,” and “7 Very important.”
- For survey items 1-99, the “percent favorable” category (for satisfaction indicators) includes the following original response options: “5 Somewhat satisfied,” “6 Satisfied,” and “7 Very satisfied.”
- For survey item 101, the “percent favorable” category (for satisfaction indicators) includes the following original response options: “4 About what I expected,” “5 Better than I expected,” “6 Quite a bit better than I expected,” and “7 Much better than I expected.”
- For survey item 102, the “percent favorable” category (for satisfaction indicators) includes the following original response options: “5 Somewhat satisfied,” “6 Satisfied,” and “7 Very satisfied.”
- For survey item 103, the “percent favorable” category (for satisfaction indicators) includes the following original response options: “5 Maybe yes,” “6 Yes,” and “7 Definitely yes.”
